About
.svg)
Hello! I'm Rajat Dhawan, a recent graduate from Arizona State University with a master's degree in Business Analytics. With over 5 years of experience in data science, I bring a unique blend of academic knowledge and practical expertise to the table.
At Onsemi, where I currently work as a Data Analyst, I lead impactful initiatives around data quality management and business intelligence. I developed automated Python scripts to identify data quality issues across massive datasets, resulting in a 5% improvement in data accuracy for supply chain systems. My work also includes building BI dashboards using Snowflake and Tableau, tracking project schedules, and achieving measurable improvements in project KPIs. I also played a pivotal role in building a chatbot leveraging RAG architecture and large language models like GPT-4 to efficiently retrieve domain-specific information, enhancing productivity for program managers.
During my time at Suzuki Motor Corporation, India's largest automotive manufacturer, I worked as a Data Scientist in the Engineering R&D division for Electric Vehicles. In this role, I designed and developed data workflows to clean, manage, and analyze large-scale fleet and telematics data of EV prototypes undergoing on-road evaluations. I regularly presented technical reports and dashboards to business executives and global teams, monitoring EV performance metrics for Product Development purposes.
At ASU, I engaged in various projects covering diverse domains such as data management, statistical analysis, Machine Learning, Natural Language Processing, and Deep Learning. One of my most significant recent achievements was working alongside a team at HCL Software to build an Identity Resolution solution using PII data points from four different data sources. Our project received recognition as the Best Capstone Project among 40 other academic projects.
I have also successfully completed several other notable projects, including Retail Product Detection using Computer Vision, Fraud Detection using Machine Learning, Revenue Prediction using Regression, and BI Dashboards for Sales/HR/Data Science Salary trends. I invite you to explore my projects to see the range of my skills and accomplishments.
SQL | Python | MATLAB | Tableau | Power BI
NumPy | Pandas | Scikit-learn | Plotly/DASH | NLTK | SpaCy | Tensorflow | Keras | SciPy | Matplotlib | Seaborn
Education
Master of Science in Business Analytics
Arizona State University - W.P. Carey School Of Business
Aug 2022 - May 2023
Bachelor of Technology - Engineering
Manipal University Jaipur
Jul 2014 - Jun 2018
Professional Experience
OnsemiAug 2023 - Present
Data Analyst Scottsdale, Arizona
- Led the development and implementation of automated Python scripts to identify data quality issues across 12 large scale data sources, resulting in a 5% improvement in data quality for supply chain systems & reducing manual intervention.
- Designed and developed comprehensive BI dashboards using Snowflake and Tableau to track project schedules for New Product Development projects, resulting in a 10% improvement in project schedule KPIs
- Built a chatbot leveraging RAG architecture and large language models like OpenAI GPT 4.0 to efficiently retrieve domain-specific SOPs and historical project insights, improving program managers' productivity and decision-making
- Implemented a machine learning algorithm achieving 93% accuracy in predicting schedules for new product development using key features impacting project schedules, optimizing planning for projects across 3 business units
HCL SoftwareDec 2022 - May 2023
Data Science Intern Sunnyvale, California
- Designed a Customer Identity Resolution method by building a Natural Language Processing pipeline utilizing Fuzzy Matching, TFIDF and Cosine Similarity techniques to cluster customers across 4 digital channels, achieving an accuracy of 88%
- Facilitated efficient customer management by clustering customers into unique customer identity and unique household identity indirectly minimizing targeted marketing campaign costs by 20%
Suzuki Motor CorporationApr 2022 - Jul 2022
Data ScientistGurgaon, India
- Led $1M project to develop automated reporting of key performance metrics for EV & Hybrid products by building analytic frameworks (ETL) in Python & MATLAB, which enabled team to manage, clean and process big data efficiently
- Identified optimum EV Charger locations and EV Range requirement by analyzing historical driving trends of 300+ customers using geospatial time-series data in Python to assist PMs & VPs build key baseline metrics for New Product Development
- Collaborated with a cross-functional team of product managers & third-party software vendors to define product requirements for integrating multiple EV chargers onto a unified platform, leading to improved customer experience
Suzuki Motor CorporationJul 2018 - Mar 2022
Data AnalystGurgaon, India
- Improved product metric by 8% and resolved system-level issues by analyzing vehicle performance trends across different traffic patterns, regions, and drive modes through weekly & monthly technical reports to support global teams in product development
- Programmed complex SQL queries utilizing multiple joins, nested queries, analytical functions to extract, manipulate and analyze data from databases to track metrics, seasonal trends, and provide actionable insights for product
- Reduced performance report generation time by 10% by developing a user-friendly graphical user interface (UI) in Python & MATLAB, to enable teams to choose projects, analysis task & dates. This led to streamlined processes & increased efficiency
- Achieved 23% reduction in data processing time by assisting team to migrate analysis workflow to open-source technologies like Python, bringing down cost of analysis by $10K annually
- Initiated Fleet Data Analytics dashboards to standardize reporting of performance metrics across 5 Hybrid & Electric Vehicle projects using DASH and Plotly
Projects
As a data scientist, I've embarked on a remarkable journey exploring diverse domains in the world of data science. Through my projects, I've harnessed the potential of Business Intelligence, Machine Learning, Natural Language Processing (NLP), and Deep Learning to address real-world challenges and make data-driven decisions.
With a passion for data science and innovation, I'm committed to driving positive impact and growth through cutting-edge data technologies.

Business Intelligence & Insights
Sales & Financial Dashboard

- I recently developed a Business Intelligence (BI) Dashboard, a powerful tool designed to monitor and analyze crucial sales and profit metrics, along with product quantity. With an emphasis on user-friendliness, this dashboard empowers stakeholders to gain valuable insights into your company's performance.
- Key features of the BI Dashboard include essential KPIs such as Total Sales, Total Profit, and Total Quantity, providing a comprehensive overview of your business's health. What sets this dashboard apart is its ability to compare current data with the previous year's figures, expressed as percentages, enabling you to gauge growth and identify areas needing attention.
- The intuitive and interactive graphs enhance data presentation. Discover sales and profit trends across different states in the United States, facilitating regional analysis. Additionally, explore sales and profit figures for the current year, segmented by customer groups, offering insights into customer preferences and shaping tailored marketing strategies.
- The dashboard also incorporates location-based sales data, matched with corresponding manager performance metrics. This invaluable feature allows you to optimize sales operations and improve overall performance by assessing manager effectiveness in various regions
- VIEW DASHBOARD
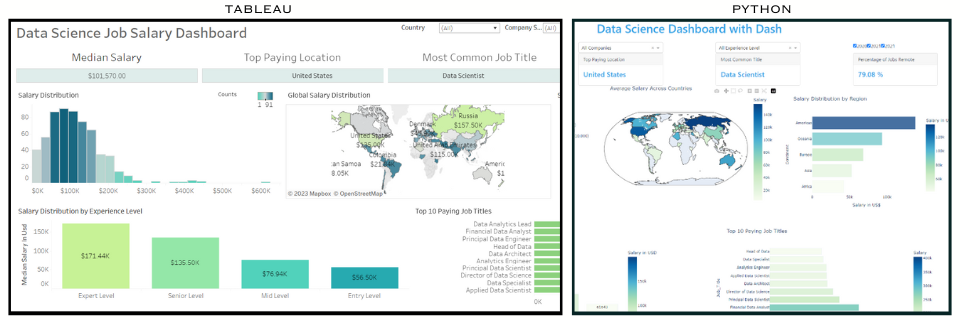
Data Science Salary Dashboard for Graduates
Human Resources / Peoples Analytics Dashboard

Electric Vehicle Performance Analytics

Machine Learning : Regression/Classification
Restaurant Revenue Prediction using Regression
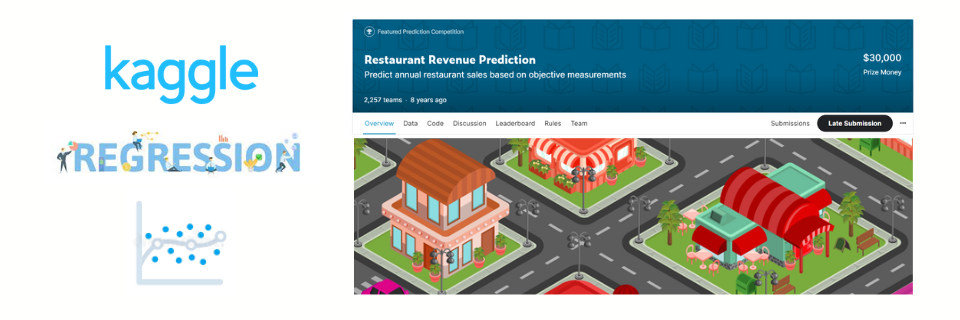
- In this regression project, we tackled a critical challenge faced by TFI, a global company operating over 1,200 quick-service restaurants, including well-known brands like Burger King, Sbarro, Popeyes, Usta Donerci, and Arby’s. The company's success hinges on strategically opening new restaurant sites across different regions, a process primarily reliant on subjective judgments from development teams. However, this approach lacks precision and often leads to losses when wrong locations are chosen.
- To address this issue, we embarked on a mission to develop a data-driven mathematical model that could predict the annual restaurant sales of 100,000 regional locations. Leveraging demographic, real estate, and commercial data, we implemented various techniques to enhance the effectiveness of investments in new restaurant sites.
- Our journey began with feature transformation using One Hot Encoding for categorical data, which allowed us to represent non-numeric data in a suitable format for analysis. To streamline the data further, we employed feature selection, dropping correlated features with a threshold of more than 80%. This process ensured that only the most relevant and informative features were used for prediction.
- The heart of our project lay in regression analysis, where we applied several algorithms, including Decision Tree, Random Forest, MLP Regressor, Support Vector Regressor, and < strong>Ridge Regressors. These models enabled us to build predictive relationships between the data features and annual restaurant sales, providing valuable insights for decision-making.
- To further enhance the model's accuracy, we employed stacking using VecStack, a technique that combines multiple models' predictions to produce more robust and precise results. Additionally, we diligently optimized the models through hyperparameter tuning, fine-tuning their parameters for maximum performance. (LINK)
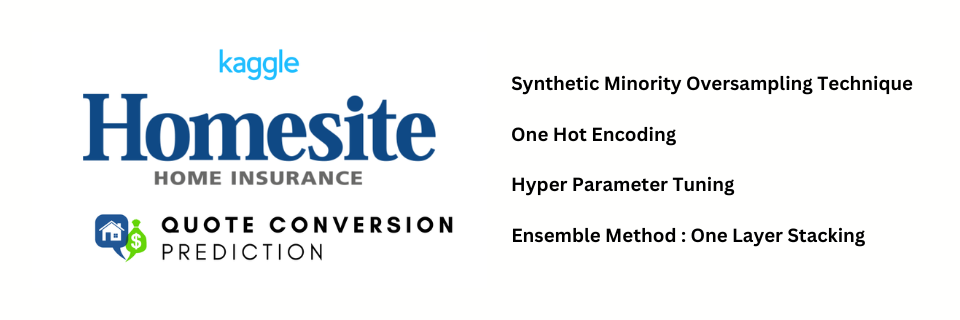
Homesite Quote Conversion using Supervised Classification
- In this classification project, our goal was to predict the QuoteConversion_Flag for potential customers interested in buying policies from Homesite. The dataset provided a comprehensive representation of customer and policy information, containing anonymized features related to coverage, sales, personal details, property, and geographic data.
- To ensure accurate predictions, we initially cleaned the dataset and removed any null values. However, during exploratory data analysis (EDA), we discovered that the dataset was imbalanced, with one class significantly outnumbering the other. To address this issue, we implemented the SMOTE strategy only on training dataset, generating synthetic data points for the minority class, thereby balancing the dataset.
- For data preparation, we transformed all categorical data points into one-hot encoded values to ensure compatibility with various classification algorithms. We then created and fine-tuned several individual models, including Decision Tree, Random Forest, Linear SVC, KNN, and Neural Nets Classifiers, using hyperparameter techniques such as random search and grid search for optimal performance.
- To further enhance the accuracy of our predictions, we designed an ensemble prediction model using a one-layer stacking approach. This ensemble model combined the strengths of Decision Tree, Random Forest, Support Vector Machines, Multi-Layer Perceptron, and K-Nearest Neighbors classifiers. Through meticulous fine-tuning and integration, we achieved an impressive accuracy rate of over 90% (LINK)
Fraud Detection using Machine Learning

- In this data mining project focused on fraud detection, we address the widespread issue of fraud across domains such as auto insurance claims, health insurance claims, credit card transactions, and financial transactions. Utilizing data from an actual auto insurance company, each record in the dataset represents an insurance claim, with the last column indicating its fraudulent status.
- Our ML Pipeline follows a similar approach to the above method, with a key emphasis during model evaluation on minimizing False Negatives. Our goal is to avoid misclassifying fraudulent transactions as regular ones. By prioritizing the reduction of False Negatives, we aim to enhance the accuracy and effectiveness of our fraud detection system. (LINK)
More Classfication Projects :
Santander Customer Satisfaction,
Direct Marketing
Natural Language Processing
CostCo Topic Modeling & Sentiment Analysis
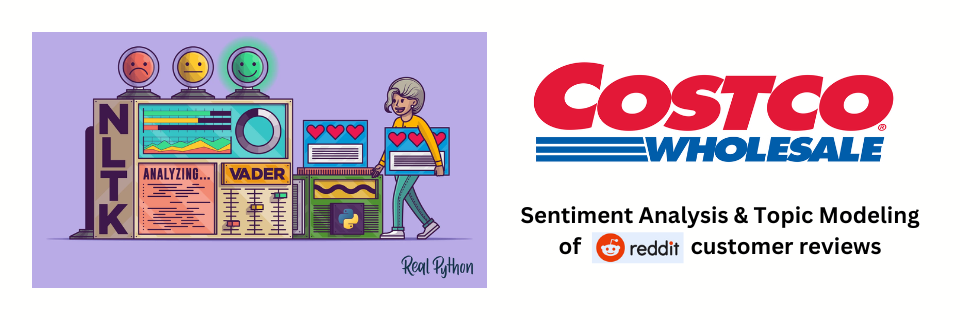
- In the Costco NLP Project, our primary focus was to gain insights from customer reviews on Reddit related to Costco products and services. To achieve this, we collected a substantial dataset of around 99,000 customer reviews using web scraping through the Reddit PRAW API. By removing stop words, applying stemming, and lemmatizing tokens, we ensured that the text data was refined and ready for analysis.
- Our analysis began with Topic Modeling using gensim's LDA (Latent Dirichlet Allocation) to categorize each review into different topics. To determine the optimal number of clusters or topics, we employed coherence plots, ensuring meaningful and relevant groupings of customer discussions.
- Next, we delved into Sentiment Analysis, a crucial aspect of NLP, to understand the overall sentiment of the reviews. Leveraging TextBlob and VADER models, we calculated Polarity scores for each review, enabling us to gauge its positive, negative, or neutral sentiment.
- By combining the results of Topic Modeling and Sentiment Analysis, we effectively categorized the sentiment associated with various topics discussed on Reddit about Costco. This comprehensive analysis provided valuable insights into customer perceptions, allowing Costco to gain a deeper understanding of its products and services' strengths and areas of improvement. (LINK)
Text Mining with Customer Comments

- In this project, we harness the combined power of NLP and ML to predict customer churn in a Telecommunication Company. By integrating structured (personal) and unstructured (complaint text) data, our powerful predictive model accurately identifies potential churners, enabling data-driven decisions for improved customer retention and satisfaction.
- Our process begins by transforming the semi-structured complaint data from "comments.csv" into a usable TFIDF matrix. We also preprocess categorical data points in the personal information to ensure it's ready for analysis. Next, we employ feature selection using both Filter and Wrapper methods, ensuring only meaningful features are included, enhancing the model's performance and interpretability.
- For model development, we utilize Decision Trees, Random Forest, and Gradient Boosting algorithms to build predictive models.
- This project showcases the power of incorporating text data into predictive modeling, providing deeper insights into customer behavior and driving strategic business decisions for the Telecommunication Company. (LINK)
Deep Learning & Computer Vision
Retail Product Detection using Computer Vision

- In this Computer Vision project, our aim is to build a robust Retail product detection method using convolutional neural nets. To achieve this, we created a training dataset for specific products (Hotdog, Soda, Coffee, Banana) by collecting 200 diverse images for each product through web scraping using Beautiful Soup. We standardized image sizes, renamed them based on their classes, and manually validated the dataset for effective training.
- For accurate product detection, we implemented a CNN model with transfer learning. By fine-tuning the ResNet50, VGG16, and InceptionV3 pre-trained models and re-configuring their architectures, we adapted them to identify the targeted products.
- Our efforts resulted in impressive outcomes, with the RESNET50 model achieving a remarkable validation accuracy of 91% in just 10 epochs.
- To enhance user experience, we designed a user-friendly Streamlit interface. This intuitive platform enables seamless model selection, threshold adjustment, and real-time image capturing, facilitating instant product classification and easy cart addition. (LINK)
Extra-curriculars
Leadership & Volunteer Work

- Member of Beta Gamma Sigma Honor Society
- Event Production Lead at TEDx Manipal University Jaipur
- Spearheaded a team of 20 students to procure production equipment and manage TEDx event guidelines for TEDxManipalUniversity Jaipur.
- Coordinated rehearsal activities for 10 speakers, customizing stage ambience and audio preferences for each speaker in collaboration with the Curation team.
- President of Music Society at Manipal University Jaipur
- Led and directed a dynamic core team of 5, successfully organizing 12 events at Intra and Inter-College festivals, providing a platform for ~200 club members to showcase their talents.
- During my term as president, the club excelled, earning more than 20 awards at various Inter-College Competitions. Additionally, conducted regular Mentorship Classes to guide students in mastering musical instruments and vocals
- Executive Committee of Oneiros Cultural Festival at Manipal University Jaipur
- Oversaw a team of 60 members in organizing main-stage events such as Artist Night and War of Bands, handling all aspects from artist contracts to financial matters, while attracting an impressive footfall of around 7000 students.
- Collaborated with other executive members to strategize sponsorship, logistics, hospitality, and festival promotions for annual cultural festival.
Certificates & Achievements
- Lean Six Sigma Green Belt Arizona State University
- Best MSBA Capstone Project Arizona State University
- Quarterly Excellence Award Maruti Suzuki India Limited
- NLP - Natural Language Processing using Python Udemy
- SQL Basic, Intermediate, Advanced HackerRank
- Data Science: R Basics HarvardX on edX
- Machine Learning with MATLAB MathWorks
- MATLAB Onramp MathWorks
- Introduction to SQL DataCamp
- Introduction to Python DataCamp
- Introduction to Java Hewlett Packard
Elements
Text
This is bold and this is strong. This is italic and this is emphasized.
This is superscript text and this is subscript text.
This is underlined and this is code: for (;;) { ... }. Finally, this is a link.
Heading Level 2
Heading Level 3
Heading Level 4
Heading Level 5
Heading Level 6
Blockquote
Fringilla nisl. Donec accumsan interdum nisi, quis tincidunt felis sagittis eget tempus euismod. Vestibulum ante ipsum primis in faucibus vestibulum. Blandit adipiscing eu felis iaculis volutpat ac adipiscing accumsan faucibus. Vestibulum ante ipsum primis in faucibus lorem ipsum dolor sit amet nullam adipiscing eu felis.
Preformatted
i = 0;

while (!deck.isInOrder()) {
    print 'Iteration ' + i;
    deck.shuffle();
    i++;
}

print 'It took ' + i + ' iterations to sort the deck.';
Lists
Unordered
- Dolor pulvinar etiam.
- Sagittis adipiscing.
- Felis enim feugiat.
Alternate
- Dolor pulvinar etiam.
- Sagittis adipiscing.
- Felis enim feugiat.
Ordered
- Dolor pulvinar etiam.
- Etiam vel felis viverra.
- Felis enim feugiat.
- Dolor pulvinar etiam.
- Etiam vel felis lorem.
- Felis enim et feugiat.
Icons
Actions
Table
Default
| Name |
Description |
Price |
| Item One |
Ante turpis integer aliquet porttitor. |
29.99 |
| Item Two |
Vis ac commodo adipiscing arcu aliquet. |
19.99 |
| Item Three |
Morbi faucibus arcu accumsan lorem. |
29.99 |
| Item Four |
Vitae integer tempus condimentum. |
19.99 |
| Item Five |
Ante turpis integer aliquet porttitor. |
29.99 |
|
100.00 |
Alternate
| Name |
Description |
Price |
| Item One |
Ante turpis integer aliquet porttitor. |
29.99 |
| Item Two |
Vis ac commodo adipiscing arcu aliquet. |
19.99 |
| Item Three |
Morbi faucibus arcu accumsan lorem. |
29.99 |
| Item Four |
Vitae integer tempus condimentum. |
19.99 |
| Item Five |
Ante turpis integer aliquet porttitor. |
29.99 |
|
100.00 |